marchmeena29/iStock via Getty Images
Written by Nick Ackerman, co-produced by Stanford Chemist. This article was originally published on June 2nd, 2022 to members of the CEF/ETF Income Laboratory.
Eaton Vance Tax-Managed Buy-Write Opportunities Fund (NYSE:ETV) has been having a difficult 2022. The fund has a tilt towards tech stocks, which has put pressure on the fund. The options strategy the fund employs helps soften some of the downside. Which is what we saw in our recent article with Eaton Vance Tax-Managed Buy-Write Income Fund (ETB).
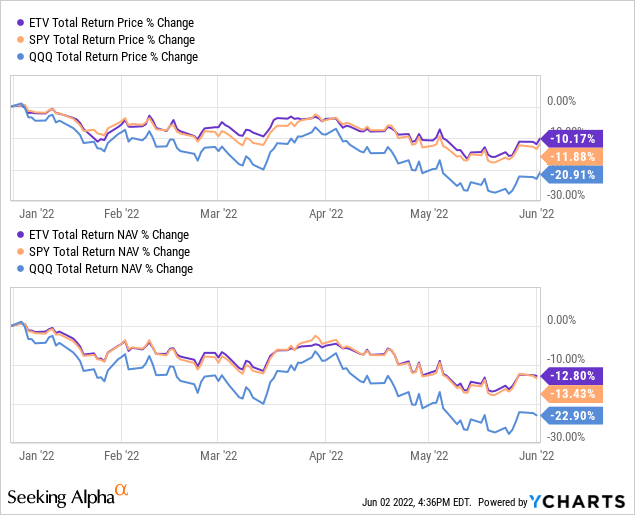
ETB benchmarks against the S&P 500 Index. ETV is quite similar but benchmarks against the S&P 500 and Nasdaq 100. This tilt to the Nasdaq is where its heavier tech exposure comes from. With that being the case, we could have assumed that the performance of ETV on a YTD basis would be somewhere between the SPDR S&P 500 ETF Trust (SPY) and the Invesco QQQ ETF (QQQ).
However, the actual results on a YTD basis show that on both the share price and NAV return basis, ETV has held up better. This is a positive for the fund. I believe this helps demonstrate that the index option writing they are employing is doing something to contain some of the downside.
YCharts
For an investor looking for tax-advantaged income, I believe that ETV could fit that need. Here’s a recap of the “simple version” of return of capital discussion we had in our recent ETB article:
This is one of those Eaton Vance funds that purposely produce distributions that are classified as return of capital. I know some investors immediately see return of capital and write a fund off. However, for this fund, it is by design. This is a topic we discuss a lot when updating coverage on these index writing Eaton Vance funds.
The simple version is that they generate realized losses on their options strategy or on the underlying portfolio. If the indexes are rising, their options strategy causes losses, but the underlying portfolio would presumably appreciate. When indexes are falling, their options strategy can provide realized gains, but these can be offset by selling off underlying positions for a loss.
What ends up happening is the fund tries to avoid having too many realized gains. When return of capital makes up all or a portion of the characterization of the distribution, it defers an investor’s tax obligation. This is done because return of capital reduces an investor’s cost basis. Therefore, no tax will be paid in the year it is received. At least under the current tax law. It would only happen when an investor sells for a realized gain or when the cost basis gets down to $0.
The Basics
- 1-Year Z-score: 0.86
- Premium: 4.96%
- Distribution Yield: 9.36%
- Expense Ratio: 1.08%
- Leverage: N/A
- Managed Assets: $1.469 billion
- Structure: Perpetual
ETV’s investment objective is to “provide current income and gains, with a secondary objective of capital appreciation.” To achieve this, the fund will invest “in a diversified portfolio of common stocks and writes call options on one or more U.S. indices on a substantial portion of the value of its common stock portfolio to seek to generate current earnings from the option premium.”
The size of the fund makes this one of the largest Eaton Vance option writing funds available. This can be important due to liquidity concerns. The average daily trading volume for ETV comes to nearly 317k shares a day. For most stocks, this might seem low, but for CEFs, this is actually quite high. It is certainly enough volume for most retail investors.
The fund’s expense ratio is also on the lower side for a CEF. Lower expense ratios are another positive of the Eaton Vance lineup of funds, making them more attractive.
Performance – Tech Hurts
The market has been reminding us that things can turn ugly, and they can stay ugly for months when investing. 2022 has been a tough slog for the most part, and there has been plenty of volatility. However, one of the biggest areas getting hit is tech.
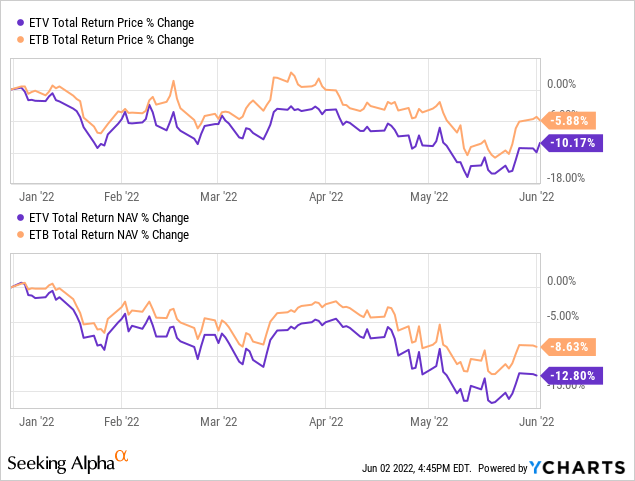
Since ETV is relatively heavier in tech than its sister fund ETB, we have been seeing that ETV is underperforming on a YTD basis.
YCharts
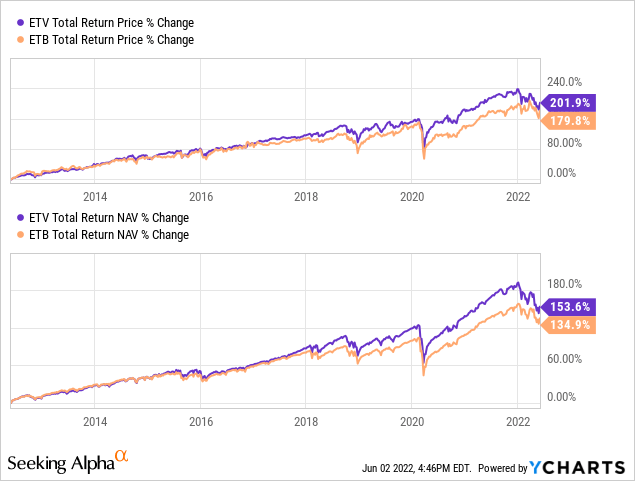
However, it is that same tech exposure that has translated into the fund providing more attractive returns over longer periods of time. Here is the performance comparison between these two funds over the last ten years.
YCharts
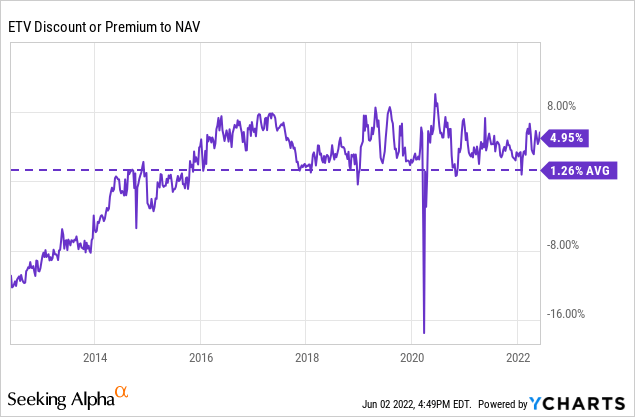
At the same time, the funds are both trading at some high premiums. While I put that as somewhat of a caution for ETB, it isn’t as much of a concern for ETV. The premium is lower at this time. Historically, ETV has traded a tad richer than ETB.
We’ve observed mean reversion in CEFs having a powerful impact on the outcome of a fund’s performance. Therefore, the fund’s premium can be a bit more justified on that basis. Of course, these cycles can break at any time. ETB might be the new fund to trade at loftier premiums for years to come.
At the same time, these funds had traded at deep discounts for a period of time too. Those periods just happened to be relatively shorter.
YCharts
Distribution – Attractive Yield, But Under Watch
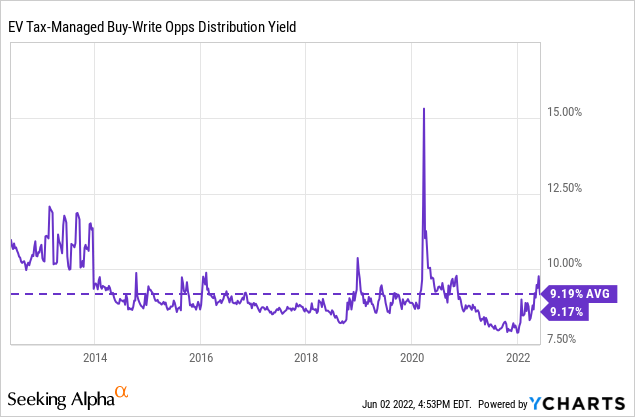
ETV is an equity fund, and they generate their earnings primarily through capital gains and appreciation of the portfolio. That’s why they tend to require equities to be rising in order to pay out their distributions to shareholders. At this time, the fund’s distribution yield comes to 9.36%. On a NAV basis, it comes to an elevated 9.82%.
Based on the last ten years’ average, this is exactly where the fund’s distribution yield has sat. So it doesn’t seem to be too concerning at this time. However, if the markets continue to hit lows and these depressed prices last longer, then this is something we should be watching.
YCharts
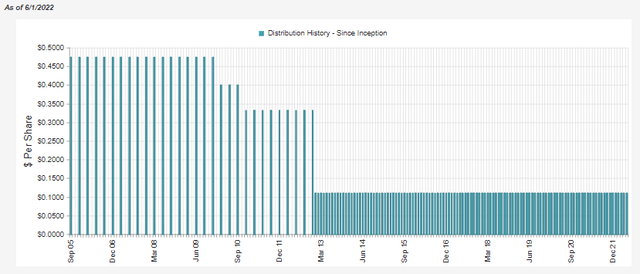
The fund only has two cuts in its history. This was shortly after the 2008/09 GFC. At one point, they switched from a quarterly to a monthly distribution. This is often more attractive for income investors. When they made that switch, they kept the same equivalent payout.
ETV Distribution History (CEFConnect)
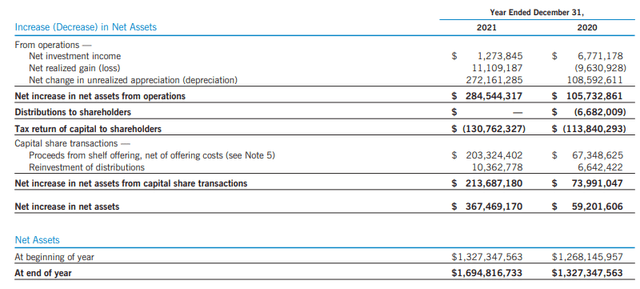
Looking at the fund’s last Annual Report can give us a better idea of what is going on under the hood. Overall, the fund doesn’t generate a significant amount of net investment income. Additionally, due to the limiting of realized gains and their options strategy, we see a small amount for net realized gains as well.
ETV Annual Report (Eaton Vance)
When looking at a bit further of the breakdown of realized gains, we can see that the fund actually realized nearly $97 million in gains. However, a majority of these gains were easily washed away by the nearly $86 million in written option losses. This is exactly where the return of capital comes in. Yet, the fund can continue to grow due to the underlying portfolio appreciation.

ETV Annual Report (Eaton Vance)
In 2021, the fund saw over $272 million in unrealized gains. That more than offset the $130.762 million in distributions it paid out to shareholders.
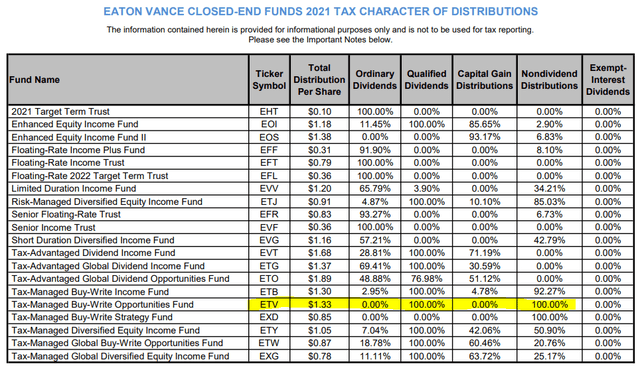
This all translated into 100% of ETV’s distribution being characterized as return of capital in the previous year.
ETV Tax Classifications (Eaton Vance)
ETV’s Portfolio
Due to the fund’s deliberate approach to reducing tax obligations, the fund’s portfolio is actually rather boring. They don’t have a lot of turnover – just 9% reported from the previous year. However, in 2017, they reported it was just 4%.
The general idea is that they aren’t doing a lot of buying or selling in the underlying portfolio. It’s a bit like an ETF, and why they can be so tax-efficient is because they just passively follow an index and don’t make a lot of changes. Therefore, never realize those underlying gains in the portfolio (nor are they paying them out either.) This is a bit similar to how ETV is operating, but then the options strategy takes it up another notch. An important note, I know not every ETF is passive. There are many more actively managed funds coming to market.
The fund doesn’t need to trade a lot unless the S&P 500 and Nasdaq 100 change significantly. Changes happen, but not an overwhelming amount. For ETV, they only hold 187 positions too. They just need to mirror the ones that will potentially have the biggest impact on moves in the underlying indexes. These positions act as a hedge for the fund’s index option writing strategy.
If the indexes were going wildly higher and the fund’s portfolio didn’t mimic similar moves, then there would be meaningful destructive losses to the fund. The index options are cash-settled, so the higher the indexes go, the greater the loss on the strategy. That’s why they would also need their underlying portfolio to be going wildly higher.
All this means that ETV’s portfolio just doesn’t change a lot. The top ten names we see now were mostly the same names we see repeatedly. Here are the top ten at the end of March 2022, available from their Fact Sheet. The top ten account for a concentrated 41.01%. This is just a bit over the year-ago figure of 40.06%.
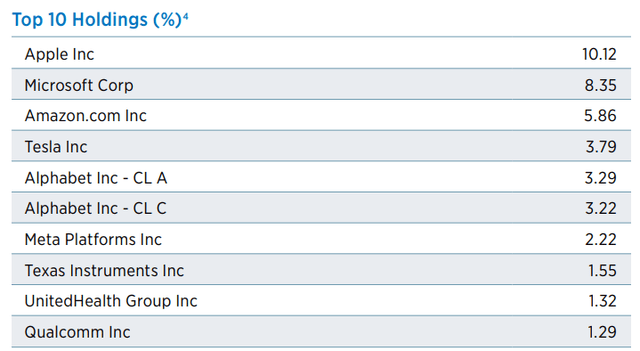
ETV Top Ten (Eaton Vance)
In particular, we see an incredibly large weighting to the mega-cap tech names. This is more so than what we see in ETB. Again, this highlights the greater tech tilt that ETV is required to hedge for its options strategy.
Conclusion
ETV generates a lot of return of capital for shareholders. However, this is the “good” or “constructive” return of capital where the fund can stay relatively flat over time. The fund is at a bit of an elevated premium but isn’t pushing into anything too excessive at this point. On top of this, the underlying portfolio has also dropped quite significantly, which has reduced the valuations on that basis too. Overall, I believe that ETV is a solid long-term investment for income investors.