Igor Kutyaev/iStock via Getty Images
Written by Nick Ackerman, co-produced by Stanford Chemist. A version of this article was originally published to members of the CEF/ETF Income Laboratory on May 9th, 2022.
Eaton Vance Tax-Advantaged Global Dividend Income Fund (NYSE:ETG) has been one of the main places where I gain my global equity investment exposure. It is a bit of a hybrid fund that also has some weighting in fixed-income investments. However, the overwhelming majority is often in equity positions. It is also a leveraged fund, so I’ve offset this exposure by adding other call-writing funds in an attempt to balance out the risks.
Historically, this fund has delivered solid returns to investors. However, it most definitely isn’t immune to what we have been experiencing in 2022. The fund has performed quite terribly if we are being frank. If we look at the total returns YTD, the price is down almost 25% at this point. That’s where that leverage risk comes in.
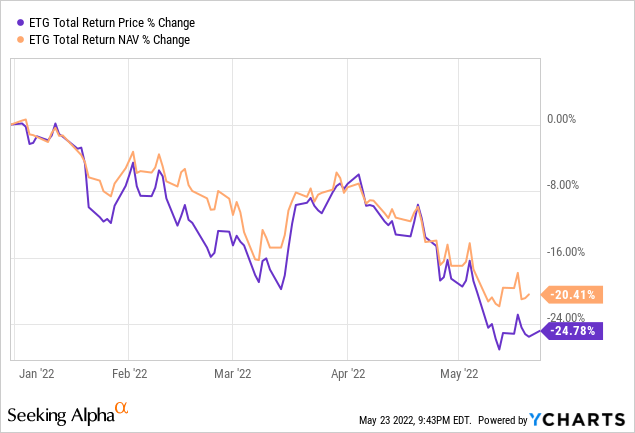 Data by YCharts
All this being said, I think at this time, with a discount and the overall decline we have been experiencing, one could potentially add to this position. I think there are two risks to be aware of. The main one, no one knows exactly when the bottom will be in, so we could continue to fall. Potentially, we could fall another 20%+ from here – no one can know for sure.
The second risk is that I believe there is now a real risk of a distribution cut. ETG spent years with the same $0.1025 monthly distribution after only cutting once in its life. That was during the 2008/09 GFC. They then eventually raised this last year – finally!
Unfortunately, it seems to be at a terrible time now that we see how 2022 is treating us. From experience, though, Eaton Vance tends to be a bit quick to cut their distributions. Now that ETG’s NAV rate is pushing around 8.5%, I wouldn’t quite bank on that payout anymore.
The Basics
- 1-Year Z-score: -1.97
- Discount: 6.26%
- Distribution Yield: 9.43%
- Expense Ratio: 1.12%
- Leverage: 20.96%
- Managed Assets: $1.765 billion
- Structure: Perpetual
ETG invests “primarily in global dividend-paying common and preferred stocks and seeks to distribute a high level of dividend income that qualifies for favorable federal income tax treatment.” This means they are looking for the company’s whose dividends are considered to be qualified dividend income. Of course, that is good for investors who might hold this in a taxable account. It would reduce the tax obligation for an investor, which is where the “tax-advantaged” portion of its name comes from.
This is one of those funds where the emphasis on income comes in. That’s why we see the net investment income contribute to a sizeable portion of the earnings for the fund. In fact, this is the first fund that comes to mind when thinking about high NII coverage from mostly equity investing funds.
The fund utilizes leverage to enhance returns potentially. As we’ve seen in the performance chart at the opening of this article, it also can work against us when the market is declining. Due to the declines in the fund, the leverage ratio has ticked higher from around the 18% it was previously. They deleveraged in 2020, but it doesn’t appear that they have added any of that leverage back even as the fund has rebounded significantly.
Additionally, the borrowings are based on a floating rate. This means that as interest rates rise, the interest expenses will be a negative for the fund going forward too. It is based on 1-month LIBOR plus 0.50%, which makes it relatively cheap for CEF financing.
The expense ratio comes in at a fairly reasonable 1.12%; when including leverage expenses, it comes to 1.27%. For the last five years, it was 2019 that gave us “peak” interest expenses. That came to 1.01%, driving the total expenses of the fund up to 2.23% for that year. This time, rates are supposed to go even higher to combat inflation. This gives us a bit of a guide on just how high the interest expenses can get when they rise. Keeping their leverage low at this point seems prudent.
Performance – Attractively Priced After Declines
Despite the struggling performance through 2022, annualized historical returns still come in favorable for ETG when looking over the longer term.
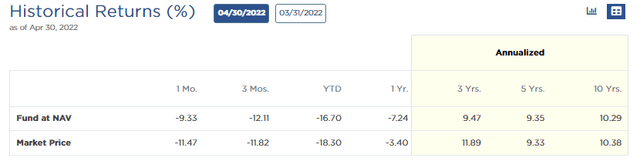
ETG Annualized Returns (Eaton Vance)
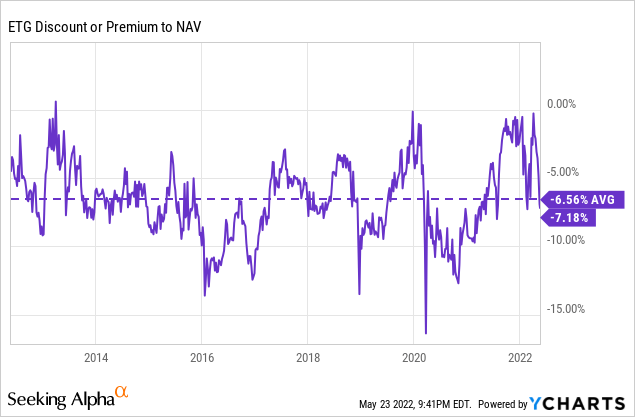
If we look at the fund’s discount, we can see that it is right around its 1-year average with the latest close. The current discount came in at 7.18%, and the last year it has averaged 3.3%. However, looking over the longer term, this fund has traded at a sizeable discount for most of its life.
 Data by YCharts
That’s why I wouldn’t necessarily consider this a screaming buy on this basis. It is more of the fact of how much the underlying portfolio and ETG itself have also declined in combination with the fund’s current discount that makes it more appealing at this time.
Throughout 2021, CEFs enjoyed historically narrow discounts. We saw funds go to premiums that hadn’t traded at premiums before or only on seldom occasions. Much of this has been unwinding now due to greater market volatility overall. These are often the times we want to be buying into these opportunities as long-term investors.
Distribution – A Trim Is Possible
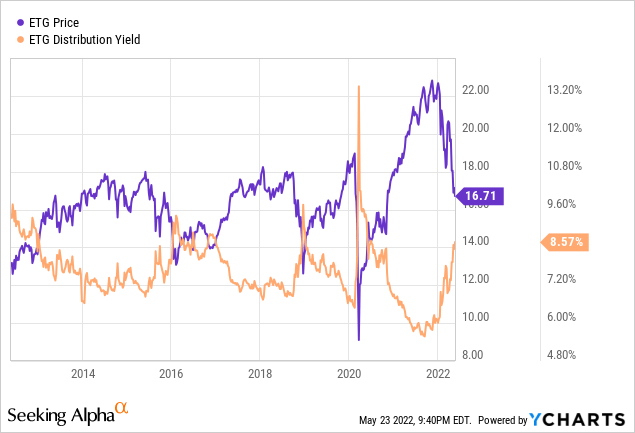
The latest distribution rate comes to 9.43%. On a NAV basis, this works out to around 8.75%. The YChart below shows us the wrong yield at this time. However, it gives us a better idea of where the yield has come in over the last ten years.
 Data by YCharts
Of course, this is a direct relationship with the fund’s share price. As the price comes down, the yield will go up if it isn’t adjusted. They survived through the 2020’s market collapse and even Q4 2018 when the market had a rates tantrum. So, I’m not necessarily expecting the distribution to be trimmed tomorrow (though it could be.) What I wanted to bring up is the fact that if this market correction stays persistent or more investments join the Nasdaq in bear territory, we could see a trim eventually.
In terms of distribution coverage, we haven’t received an updated report yet. That should be coming sometime towards the end of June. Here is from our previous ETG update:
As we can see, the fund only had one cut in its history, which is quite impressive. All that being said, the more peculiar subject I wanted to touch on was the distribution coverage, and that led to me being quite surprised we didn’t see a special year-end from ETG.
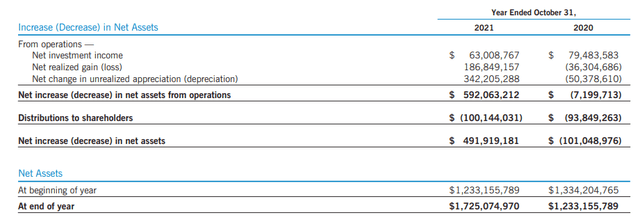
ETG increase in Net Assets (Eaton Vance)
(Source – Annual Report)
ETG is a regulated investment company (RIC). Being structured as a RIC means they have to pay out most of their income and gains to shareholders via distributions. If they fail to do this, they have to pay an excise tax of 4%.
For ETG, we can see that the fund’s NII coverage came to a substantial 63%. The capital gains the fund realized put the fund well over what was needed to fund the distribution to shareholders. As we advance, the payout to shareholders will increase because this only reflects a few months of the newly established monthly $0.13 payout.
With that being said, when we look at these sorts of gains, it usually implies a special could be necessary to keep the fund in compliance. That just didn’t happen to be the case with this fund, which shows that it isn’t a perfect guide.
The key update here for the distribution is that I’m questioning the sustainability if the overall downturn remains sticky for the next six to twelve months.
ETG’s Portfolio
Besides my generally favorable view of ETG, being able to pick up the fund at larger discounts previously, and the overall solid performance we’ve seen – the other area that gets me more excited about ETG is the portfolio’s positioning. They have an incredibly high turnover, meaning things can change rapidly. However, the fund has historically been tilted towards a heavier weighting to financial positions rather than having tech weightings well above any other exposure. Don’t get me wrong, tech is the second-largest exposure here, but we don’t see the 30%+ weightings in tech that we see with other diversified funds.
The downside of their higher turnover is that they don’t update their sector allocations but twice a year. That is in their Annual and Semi-Annual updates. The rest we have to try to gauge ourselves through their holdings, which they update quarterly. The below is from the end of October 31st, 2021.
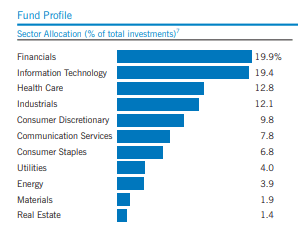
ETG Sector Weightings (Eaton Vance)
One place they update some of the portfolio data is in their quarterly Fact Sheet. Which again, is missing the key information on the sector weightings but does provide us with other important metrics. One of these is geographic weightings.
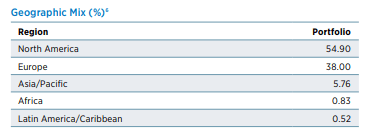
ETG Geographic Mix (Eaton Vance)
At this time, around 55% of the portfolio is invested in North America. The bulk of this is going to be U.S. positions. This is a slight decrease from the previous update, indicating that the fund has moved some assets abroad. This isn’t necessarily a bad thing, as global valuations remain attractive.
From there, we can take a look at the fund’s asset mix. This tells us how diverse the fund is invested when it comes to equity vs. fixed income. As I mentioned, the fund heavily favors equities. With this latest update, we see the same.
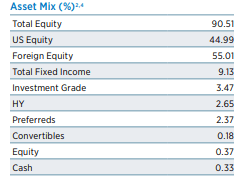
ETG Asset Mix (Eaton Vance)
In fact, the total equity allocation was previously at almost 85%. The weightings here have increased, with foreign equity seeing the largest jump and U.S. equity taking a small decline. That makes sense and is consistent with what we saw from the geographic mix. The area with the most reductions came from a mix of investment grade, high yield and preferred. Convertibles and cash also saw a small decline but aren’t too material to the fund’s outcome anyway.
Finally, to take a quick look at the fund’s top ten holdings. Despite the higher turnover of the fund, the top ten actually stay mostly static. At least the largest of the top positions do, with the mega-cap tech names present. It sort of goes against the domination of tech that I was laying out on why to invest in ETG for diversification purposes. That being said, the top positions aren’t the entire fund, and the sector weightings clearly give us an indication of that.
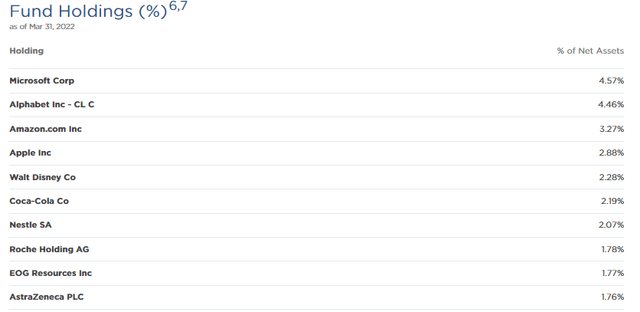
ETG Top Ten Holdings (Eaton Vance)
The largest position belongs to Microsoft (MSFT), with Alphabet (GOOG) coming in second. This is then followed up by both Amazon (AMZN) and Apple (AAPL). This update shows us that MSFT has edged out GOOG for the top spot as GOOG was once a 5.06% weighting. That being said, the weighting of both companies has still dropped in the fund to some degree.
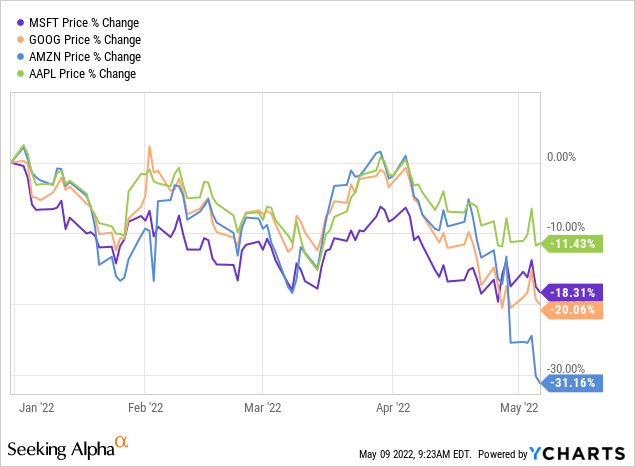
Considering that these positions are probably still being held in the fund, I think it is fair to take a look at the full YTD performance of these positions through May 9th. AMZN recently had its stock absolutely shredded due to poor earnings reception. The COVID pandemic benefits that fueled the company seem to finally be dissipating, with “cautious guidance” going forward. Inflation and supply chains also remain key issues, not only for AMZN but most companies overall.
YCharts
Conclusion
ETG has been getting absolutely whacked along with the rest of the market. We see the ugly side of what even a relatively modest amount of leverage can do to a fund when things are working against us. That being said, I believe that being a long-term investor opens us up to opportunities to add on weakness. Tactically – in the short term – we could continue to see further weakness and lower prices. That being said, I’m not one to call a bottom, and I’m firmly in the camp that I don’t think it can be done with regular consistency anyway.