News and research before you hear about it on CNBC and others. Claim your 1-week free trial to StreetInsider Premium here.
UNITED STATES
SECURITIES AND EXCHANGE COMMISSION
Washington, D.C. 20549
FORM N-CSR
CERTIFIED SHAREHOLDER REPORT OF
REGISTERED
MANAGEMENT INVESTMENT COMPANIES
Investment Company Act File Number:
811-02958
| T. Rowe Price International Funds, Inc. |
| (Exact name of registrant as specified in charter) |
| 100 East Pratt Street, Baltimore, MD 21202 |
| (Address of principal executive offices) |
| David Oestreicher |
| 100 East Pratt Street, Baltimore, MD 21202 |
| (Name and address of agent for service) |
Registrants telephone number, including area code: (410) 345-2000
Date of fiscal year end: October 31
Date of reporting period: April 30, 2022
Item 1. Reports to Shareholders
(a) Report pursuant to Rule 30e-1.
Global | April 30, 2022 |
| RPGEX | Investor Class |
| PAGLX | Advisor Class |
| RGGIX | I Class |
| T. ROWE PRICE Global Growth Stock Fund |
HIGHLIGHTS
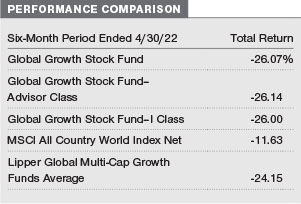
| ■ | The Global Growth Stock Fund underperformed its benchmark, the MSCI All Country World Index Net, as well as the Lipper peer group average for the six-month reporting period. |
| ■ | Relative underperformance was mainly due to stock selection in the consumer discretionary and information technology sectors. Health care names also weighed on relative performance. No sectors contributed on a relative basis for the period. At the regional level, holdings in North America detracted the most, while an underweight to Japan helped. |
| ■ | With the near-term outlook for equities more uncertain, we continue to maintain a broadly balanced portfolio with sector exposures relatively neutral to our core benchmark. Our largest overweights at the end of the reporting period were in consumer discretionary and financials, while our largest underweights were in energy and consumer staples. At the regional level, emerging markets represent a meaningful overweight due to the structural, long-term growth drivers we see in select countries. |
| ■ | We continue to experience an incredibly complex equity investment environment. We are in uncharted territory on many fronts, and the magnitude of price movements in both directions has been highly unusual. However, we remain optimistic, particularly for our portfolio, as we look out over two to three years. |

Log
in to your account at troweprice.com for more information.
*Certain
mutual fund accounts that are assessed an annual account service fee can also save money by switching to e-delivery.
Market
Commentary
Dear
Shareholder
Global
stock markets produced negative returns during the first half of your fund’s fiscal year, the six-month period ended April 30,
2022, while rising bond yields weighed on returns for fixed income investors. Fears concerning new coronavirus variants, rising interest
rates, and soaring inflation caused bouts of volatility throughout the period. These concerns were compounded by Russia’s invasion
of Ukraine in February, sending markets around the world into correction territory.
All
major global and regional equity benchmarks receded during the period. Value shares extended their recent outperformance of growth stocks
as equity investors turned risk averse. Although most sectors finished in the red, energy stocks registered exceptional returns as oil
prices jumped in response to Russia’s invasion and the ensuing commodity supply crunch. A strong U.S. dollar weighed on returns
for U.S. investors in most international markets. Across the style spectrum, developed markets held up better than emerging markets.
In
November 2021, the emergence of the omicron variant of the coronavirus prompted worries about the economic outlook and the potential
that a resurgence in cases could lead to further supply chain disruptions. While omicron variant trends and restrictions eased in most
regions early in 2022, China continued to pursue a “zero-COVID” policy, resulting in large-scale lockdowns and industrial
production disruptions.
In
February 2022, markets were caught further by surprise when Russia launched a large-scale military offensive into Ukraine. The strong
sanctions on Russia that followed raised concerns about supply chains that were already stressed by the coronavirus pandemic. On March
8, the White House announced that the U.S. was cutting off all oil imports from Russia. In response, oil prices surged to their highest
level in a decade.
Concerns
over inflation intensified over much of the period, driven in part by events in Ukraine and China. Along with supply chain problems,
the release of pent-up demand for travel, recreation, and other services also pushed prices higher. In the U.S., consumer prices rose
8.5% in March versus the year before—the highest annual reading since December 1981—driven by accelerating energy and food
prices.
Elevated
inflation caused global monetary policy to take a hawkish turn. In the U.S., Federal Reserve officials began tapering the central bank’s
monthly purchases of Treasuries and agency mortgage-backed securities in November. In March, the Fed approved its first interest rate
hike in more than three years and signaled an accelerating pace of rate increases ahead. In Europe, the Bank of England raised its key
interest rate three times in a row between December and March, while the European Central Bank indicated in March that it could end its
asset purchase program as soon as the third quarter of 2022.
Bond
indexes were broadly negative as yields rose across the Treasury yield curve amid surging inflation and expectations of aggressive monetary
tightening. (Bond yields and prices move in opposite directions.) Investment-grade corporate bonds experienced significant losses, while
municipal bonds suffered through their worst quarter in more than 40 years at the start of 2022 and finished the period lower. Late in
the period, multiple portions of the Treasury yield curve inverted briefly, raising fears of a looming recession.
The
challenges global markets face are complex and could drive market volatility for some time. Investors will be closely monitoring the
Fed’s actions as the central bank attempts to use interest rate hikes to tame inflation without stifling economic growth. Meanwhile,
the ongoing geopolitical and humanitarian crisis in Ukraine continues to disrupt supply chains, increase inflationary pressures, and
dampen consumer confidence.
During
challenging times like these, I am heartened by our firm’s long-term focus and time-tested investment approach. I also recognize
that market volatility and sector rotation historically have presented very good opportunities for active investors. I remain confident
in the ability of our global research organization to uncover compelling investment ideas that can help deliver superior long-term risk-adjusted
performance as market conditions normalize.
Thank
you for your continued confidence in T. Rowe Price.
Sincerely,

Robert
Sharps
CEO and President
Management’s
Discussion of Fund Performance
INVESTMENT
OBJECTIVE
The
fund seeks long-term growth of capital through investments primarily in the common stocks of large-cap companies throughout the world,
including the U.S.
FUND
COMMENTARY
How
did the fund perform in the past six months?
The
Global Growth Stock Fund returned -26.07% in the six-month period ended April 30, 2022. The fund underperformed the MSCI All Country
World Index Net benchmark, which returned -11.63%, as well as the Lipper Global Multi-Cap Growth Funds Average, which returned -24.15%.
(Returns for the Advisor and I Class shares varied slightly, reflecting their different fee structures. Past performance cannot guarantee
future results.)
What
factors influenced the fund’s performance?
From
a sector perspective, the fund’s underperformance was mainly due to stock selection in the consumer discretionary and information
technology sectors. Health care names also weighed on relative performance. No sectors contributed on a relative basis for the period.
At the regional level, holdings in North America detracted the most, while an underweight to Japan helped.
Within
the consumer discretionary sector, our position in Rivian Automotive was the largest relative detractor. As the reality of near-term
interest rate hikes became clearer, investors rotated out of shares of higher-growth companies valued primarily on their long duration
cash flow potential, including electric vehicle maker Rivian, which only recently went public. The company also reported a series of
disappointing results, with production taking a hit due to supply chain issues and higher operating expenses from its ongoing production
ramp. We remain confident in the long-term fundamentals of the business and view Rivian as an outstanding and unique opportunity to participate
in the automotive industry’s most powerful secular trend of electrification. (Please refer to the portfolio of investments for
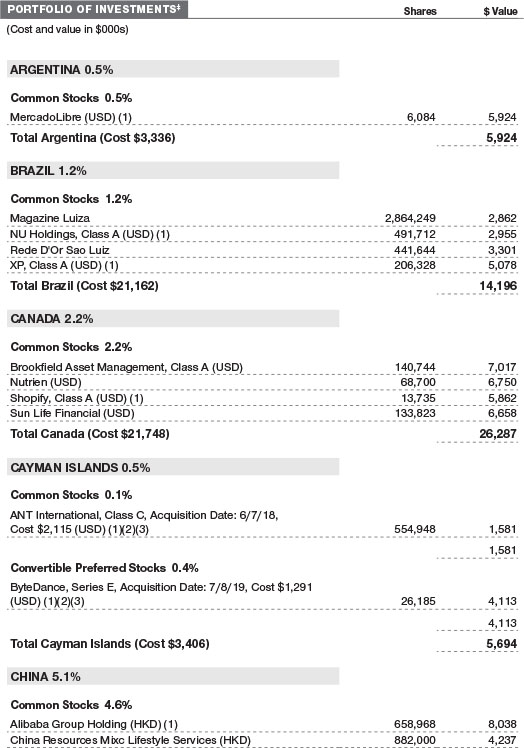
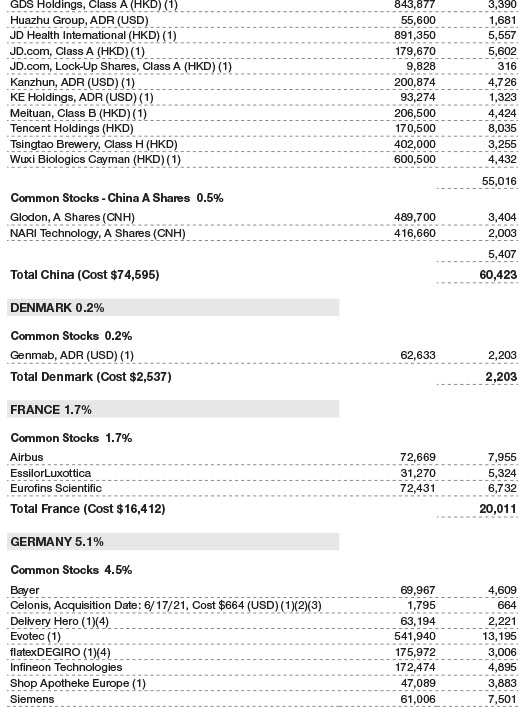
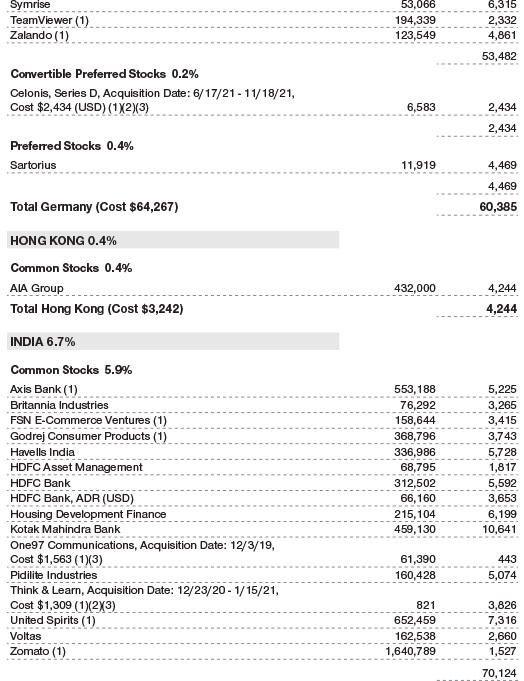
a complete list of holdings and the amount each represents in the portfolio.)
Holdings
in the information technology sector also hurt relative performance. Investors flocked to the relative safety of mega-cap technology
during the period, which propelled shares of Apple higher. While Apple is among the portfolio’s top holdings, we have an underweight
exposure to the name relative to our benchmark, which hampered relative results. We like Apple for its strong ecosystem, competitive
positioning, free cash flow generation, and massive research and development program, but the stock’s heightened valuation informs
our underweight position.
Health
care names also weighed on relative returns. Evotec is Europe’s largest contract research organization that serves as a one-stop
outsourcing shop for all preclinical activities for the pharmaceuticals industry. Shares traded lower on a number of disappointing news
items, including the announcement that Bayer, one of its partners, would be discontinuing the clinical development of eliapixant that
was being evaluated for potential indications in endometriosis, refractory chronic cough, overactive bladder, and diabetic neuropathic
pain. The company also reported disappointing first-quarter 2022 earnings results due to increased investment spending, particularly
in research and development. We think Evotec remains well positioned to benefit from secular tailwinds and deeper customer penetration
as end market businesses choose to outsource research services more often.
How
is the fund positioned?
With
the near-term outlook for equities more uncertain, we continue to maintain a broadly balanced portfolio with sector exposures relatively
neutral to our core benchmark. We are staying aligned with our global equity research platform in a thoughtful and diversified manner
and remain open-minded to changing the portfolio as opportunities present themselves. As always, we want to own companies that can produce
solid growth over a two- to three-year time horizon, while paying a reasonable price. Given the current momentum-driven nature of the
market, we are being diligent about using the opportunities presented to pick up names we like at reasonable valuations.
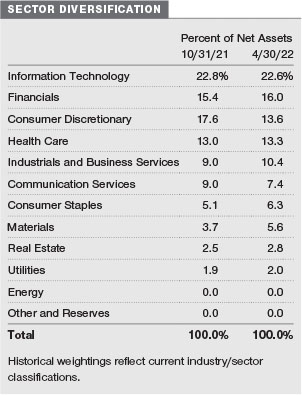
At
the end of April, the fund’s largest sector overweight was the consumer discretionary sector. The fund was also overweight the
financials and information technology sectors, though not dramatically so. While still our largest sector overweight, the overall largest
sector shift during the six-month period occurred in consumer discretionary, where we reduced our exposure as we trimmed and eliminated
names where we had less conviction over the next two to three years. We also added meaningfully to materials and reduced our exposure
to communication services.
Within
consumer discretionary we scaled back our exposure to internet and direct marketing retail names through trims of ASOS and Wayfair and
eliminations of Next, Boohoo, and Pinduoduo. We remain focused on leaders within the global online retail and consumer services ecosystems
that operate true global platforms like Amazon.com and MercadoLibre, where the investment thesis is broader than just e-commerce. We
further balanced our exposure to the sector during the period through purchases of more traditional retailers with U.S.-centric stories
like fast-casual restaurant chain Chipotle Mexican Grill, which operates an attractive, non-franchise model with strong business economics,
and well-managed home improvement retailer Home Depot, which we believe can manage inflationary prices with pricing power. Within the
sector, we also added new positions in travel-related names such as global hotel franchisor Intercontinental Hotel Group and online travel
agent Expedia, which we think are well positioned to benefit from a normalization of economic activity as the world learns to live with
COVID-19.
The
materials sector was one of the areas to which we added meaningfully over the period. There are some compelling areas in the materials
sector as demand starts to recover post-pandemic, and the sector continues to benefit from secular demand for metals that are used to
manufacture technological components like batteries as well as a growing emphasis on sustainable resources. The Russia-Ukraine conflict
has also contributed to increased demand and tightening supply in the sector, particularly in agricultural materials, where we added
several high-quality names over the quarter. Our largest addition was in Nutrien, a leading global producer of agricultural fertilizer
products like potash, nitrogen, and phosphate. Given the supply chain disruption as a result of the ongoing Russia-Ukraine conflict,
we think demand for Nutrien’s offerings will accelerate as the market looks for new capacity in potash and nitrogen. We also like
Nutrien’s retail crop inputs business, which we think could provide some stability and downside protection in an environment with
heightened commodity price volatility.
Regionally,
our weighting to developed Europe decreased meaningfully, while our exposure to emerging markets increased. Other regions had more modest
changes. We continue to be overweight fast-growing emerging markets countries that have low debt-to-gross domestic product ratios and
attractive demographic growth, such as India, Indonesia, Vietnam, and the Philippines. Despite near-term challenges, we are also finding
opportunities in China, with an emphasis on domestic exposure to areas like information technology and health care, where we believe
there is much innovation and the government is focused on building vibrant domestic industries. We have used the recent sell-off in the
region to concentrate our positions in names that we think are long-term winners. While we are underweight North America, it is still
our largest regional allocation, at approximately 58% of assets.
What
is portfolio management’s outlook?
We
continue to experience an incredibly complex equity investment environment. Markets have become increasingly more volatile across many
dimensions, and the change of pace happening in the world continues at a remarkable rate. We are in uncharted territory on many fronts,
and the magnitude of price movements in both directions has been highly unusual. However, we remain optimistic, particularly for our
portfolio, as we look out over two to three years.
The
balance of near-term data has become less positive and less certain. While it appeared that inflation was peaking in the fourth quarter,
we have seen further definitive inflation catalysts with higher oil, commodity, food, and staples pricing triggered by the ongoing humanitarian
crisis in and near Ukraine. China’s “zero COVID” policy has also added to global supply chain disruption and shortages,
while inflation is likely to create a degree of demand destruction in the near term. We are also dealing with interest rates rising sooner
and at a much quicker pace than we previously expected. All of this together has resulted in a greater risk of recession, but one driven
by shortages rather than built-up excesses in the economy. However, corporate profits appear to remain steady overall, despite pockets
of idiosyncratic weakness. We are also learning to live with COVID-19, and the long-awaited reopening is finally occurring in a tangible
way, especially in the U.S.
While
it is difficult to predict the near-term outlook for equities, we continue to leverage the deep T. Rowe Price platform in seeking to
identify the best ideas for our clients while also being open-minded to changing the portfolio given the fluid market environment. With
markets becoming more difficult to navigate with so many pushes and pulls, we are maintaining a broadly balanced portfolio with sector
exposures that are relatively neutral to our core benchmark while focusing our efforts on idiosyncratic stock picking—something
that has served us well over the history of the portfolio.
The
views expressed reflect the opinions of T. Rowe Price as of the date of this report and are subject to change based on changes in market,
economic, or other conditions. These views are not intended to be a forecast of future events and are no guarantee of future results.
RISKS
OF INTERNATIONAL INVESTING
Funds
that invest overseas generally carry more risk than funds that invest strictly in U.S. assets. Funds investing in a single country or
in a limited geographic region tend to be riskier than more diversified funds. Risks can result from varying stages of economic and political
development; differing regulatory environments, trading days, and accounting standards; and higher transaction costs of non-U.S. markets.
Non-U.S. investments are also subject to currency risk, or a decline in the value of a foreign currency versus the U.S. dollar, which
reduces the dollar value of securities denominated in that currency.
BENCHMARK
INFORMATION
Note:
Portions of the mutual fund information contained in this report were supplied by Lipper, a Refinitiv Company, subject to the following:
Copyright 2022 © Refinitiv. All rights reserved. Any copying, republication or redistribution of Lipper content is expressly prohibited
without the prior written consent of Lipper. Lipper shall not be liable for any errors or delays in the content, or for any actions taken
in reliance thereon.
Note:
MSCI and its affiliates and third party sources and providers (collectively, “MSCI”) makes no express or implied warranties
or representations and shall have no liability whatsoever with respect to any MSCI data contained herein. The MSCI data may not be further
redistributed or used as a basis for other indices or any securities or financial products. This report is not approved, reviewed, or
produced by MSCI. Historical MSCI data and analysis should not be taken as an indication or guarantee of any future performance analysis,
forecast or prediction. None of the MSCI data is intended to constitute investment advice or a recommendation to make (or refrain from
making) any kind of investment decision and may not be relied on as such.
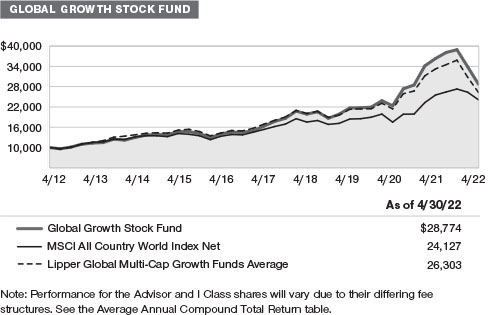
![]()
GROWTH
OF $10,000
This
chart shows the value of a hypothetical $10,000 investment in the fund over the past 10 fiscal year periods or since inception (for funds
lacking 10-year records). The result is compared with benchmarks, which include a broad-based market index and may also include a peer
group average or index. Market indexes do not include expenses, which are deducted from fund returns as well as mutual fund averages
and indexes.
AVERAGE
ANNUAL COMPOUND TOTAL RETURN
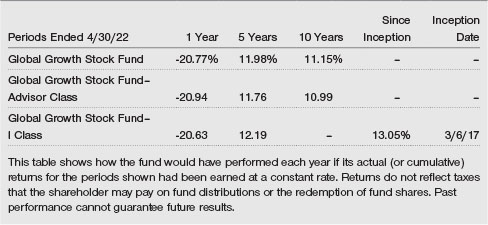
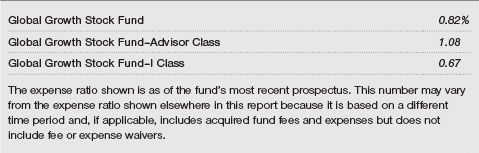
EXPENSE
RATIO
FUND
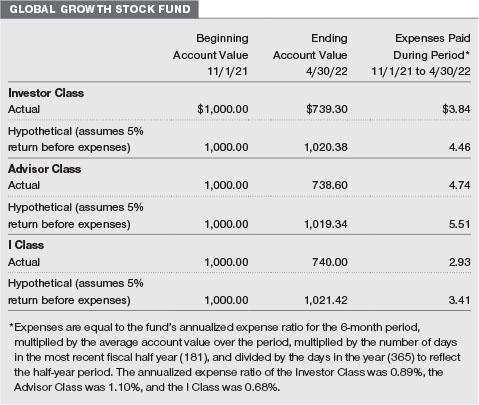
EXPENSE EXAMPLE
As
a mutual fund shareholder, you may incur two types of costs: (1) transaction costs, such as redemption fees or sales loads, and (2) ongoing
costs, including management fees, distribution and service (12b-1) fees, and other fund expenses. The following example is intended to
help you understand your ongoing costs (in dollars) of investing in the fund and to compare these costs with the ongoing costs of investing
in other mutual funds. The example is based on an investment of $1,000 invested at the beginning of the most recent six-month period
and held for the entire period.
Please
note that the fund has three share classes: The original share class (Investor Class) charges no distribution and service (12b-1) fee,
the Advisor Class shares are offered only through unaffiliated brokers and other financial intermediaries and charge a 0.25% 12b-1 fee,
and I Class shares are available to institutionally oriented clients and impose no 12b-1 or administrative fee payment. Each share class
is presented separately in the table.
Actual
Expenses
The
first line of the following table (Actual) provides information about actual account values and expenses based on the fund’s actual
returns. You may use the information on this line, together with your account balance, to estimate the expenses that you paid over the
period. Simply divide your account value by $1,000 (for example, an $8,600 account value divided by $1,000 = 8.6), then multiply the
result by the number on the first line under the heading “Expenses Paid During Period” to estimate the expenses you paid
on your account during this period.
Hypothetical
Example for Comparison Purposes
The
information on the second line of the table (Hypothetical) is based on hypothetical account values and expenses derived from the fund’s
actual expense ratio and an assumed 5% per year rate of return before expenses (not the fund’s actual return). You may compare
the ongoing costs of investing in the fund with other funds by contrasting this 5% hypothetical example and the 5% hypothetical examples
that appear in the shareholder reports of the other funds. The hypothetical account values and expenses may not be used to estimate the
actual ending account balance or expenses you paid for the period.
Note:
T. Rowe Price charges an annual account service fee of $20, generally for accounts with less than $10,000. The fee is waived for
any investor whose T. Rowe Price mutual fund accounts total $50,000 or more; accounts electing to receive electronic delivery of account
statements, transaction confirmations, prospectuses, and shareholder reports; or accounts of an investor who is a T. Rowe Price Personal
Services or Enhanced Personal Services client (enrollment in these programs generally requires T. Rowe Price assets of at least $250,000).
This fee is not included in the accompanying table. If you are subject to the fee, keep it in mind when you are estimating the ongoing
expenses of investing in the fund and when comparing the expenses of this fund with other funds.
You
should also be aware that the expenses shown in the table highlight only your ongoing costs and do not reflect any transaction costs,
such as redemption fees or sales loads. Therefore, the second line of the table is useful in comparing ongoing costs only and will not
help you determine the relative total costs of owning different funds. To the extent a fund charges transaction costs, however, the total
cost of owning that fund is higher.
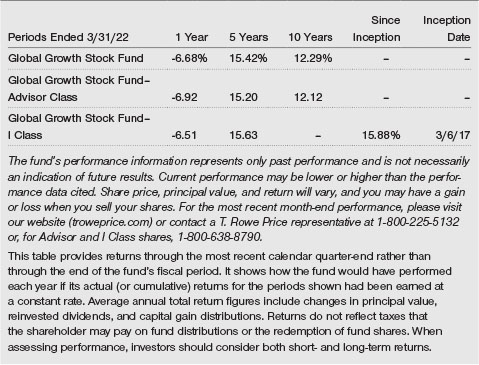
QUARTER-END RETURNS
Unaudited
The
accompanying notes are an integral part of these financial statements.
Unaudited
The
accompanying notes are an integral part of these financial statements.
Unaudited
![]()
The
accompanying notes are an integral part of these financial statements.
April
30, 2022 (Unaudited)
![]()
The
accompanying notes are an integral part of these financial statements.
April
30, 2022 (Unaudited)
The
accompanying notes are an integral part of these financial statements.
Unaudited
The
accompanying notes are an integral part of these financial statements.
Unaudited
The
accompanying notes are an integral part of these financial statements.
Unaudited
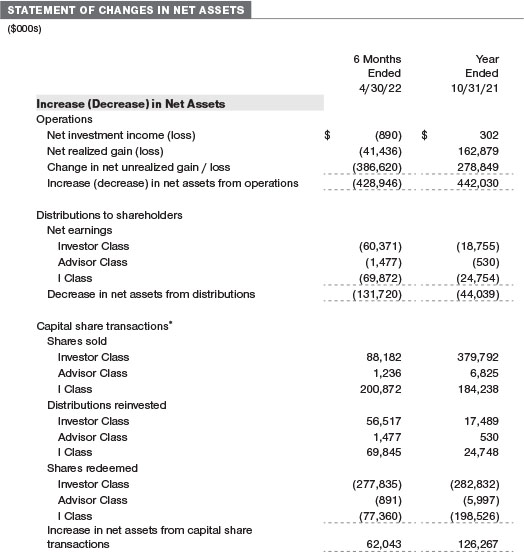
| NOTES TO FINANCIAL STATEMENTS |
T. Rowe Price International Funds, Inc. (the corporation) is registered under the Investment Company Act of 1940 (the 1940 Act). The
Global Growth Stock Fund (the fund) is a diversified, open-end management investment company established by the corporation. The fund
seeks long-term growth of capital through investments primarily in the common stocks of large-cap companies throughout the world, including
the U.S. The fund has three classes of shares: the Global Growth Stock Fund (Investor Class), the Global Growth Stock Fund–Advisor
Class (Advisor Class), and the Global Growth Stock Fund–I Class (I Class). Advisor Class shares are sold only through various brokers
and other financial intermediaries. I Class shares require a $500,000 initial investment minimum, although the minimum generally is waived
or reduced for financial intermediaries, eligible retirement plans, and certain other accounts. Prior to November 15, 2021, the initial
investment minimum was $1 million and was generally waived for financial intermediaries, eligible retirement plans, and other certain
accounts. As a result of the reduction in the I Class minimum, certain assets transferred from the Investor Class to the I Class. This
transfer of shares from Investor Class to I Class is reflected in the Statement of Changes in Net Assets within the Capital shares transactions
as Shares redeemed and Shares sold, respectively. The Advisor Class operates under a Board-approved Rule 12b-1 plan pursuant to which
the class compensates financial intermediaries for distribution, shareholder servicing, and/or certain administrative services; the
Investor and I Classes do not pay Rule 12b-1 fees. Each class has exclusive voting rights on matters related solely to that class; separate
voting rights on matters that relate to all classes; and, in all other respects, the same rights and obligations as the other classes.
NOTE
1 – SIGNIFICANT ACCOUNTING POLICIES
Basis
of Preparation The fund is an investment company and follows accounting and reporting guidance in the Financial Accounting Standards
Board (FASB) Accounting Standards Codification Topic 946 (ASC 946). The accompanying financial statements were prepared in accordance
with accounting principles generally accepted in the United States of America (GAAP), including, but not limited to, ASC 946. GAAP requires
the use of estimates made by management. Management believes that estimates and valuations are appropriate; however, actual results may
differ from those estimates, and the valuations reflected in the accompanying financial statements may differ from the value ultimately
realized upon sale or maturity.
Investment
Transactions, Investment Income, and Distributions Investment transactions are accounted for on the trade date basis. Income and
expenses are recorded on the accrual basis. Realized gains and losses are reported on the identified cost basis. Income tax-related interest
and penalties, if incurred, are recorded as income tax expense. Dividends received from mutual fund investments are reflected as dividend
income; capital gain distributions are reflected as realized gain/loss. Dividend income and capital gain distributions are recorded on
the ex-dividend date. Distributions from REITs are initially recorded as dividend income and, to the extent such represent a return of
capital or capital gain for tax purposes, are reclassified when such information becomes available. Non-cash dividends, if any, are recorded
at the fair market value of the asset received. Distributions to shareholders are recorded on the ex-dividend date. Income distributions,
if any, are declared and paid by each class annually. A capital gain distribution may also be declared and paid by the fund annually.
Currency
Translation Assets, including investments, and liabilities denominated in foreign currencies are translated into U.S. dollar values
each day at the prevailing exchange rate, using the mean of the bid and asked prices of such currencies against U.S. dollars as provided
by an outside pricing service. Purchases and sales of securities, income, and expenses are translated into U.S. dollars at the prevailing
exchange rate on the respective date of such transaction. The effect of changes in foreign currency exchange rates on realized and unrealized
security gains and losses is not bifurcated from the portion attributable to changes in market prices.
Class
Accounting Shareholder servicing, prospectus, and shareholder report expenses incurred by each class are charged directly to the
class to which they relate. Expenses common to all classes, investment income, and realized and unrealized gains and losses are allocated
to the classes based upon the relative daily net assets of each class. The Advisor Class pays Rule 12b-1 fees, in an amount not exceeding
0.25% of the class’s average daily net assets.
Capital
Transactions Each investor’s interest in the net assets of the fund is represented by fund shares. The fund’s net asset
value (NAV) per share is computed at the close of the New York Stock Exchange (NYSE), normally 4 p.m. ET, each day the NYSE is open for
business. However, the NAV per share may be calculated at a time other than the normal close of the NYSE if trading on the NYSE is restricted,
if the NYSE closes earlier, or as may be permitted by the SEC. Purchases and redemptions of fund shares are transacted at the next-computed
NAV per share, after receipt of the transaction order by T. Rowe Price Associates, Inc., or its agents.
Indemnification
In the normal course of business, the fund may provide indemnification in connection with its officers and directors, service providers,
and/or private company investments. The fund’s maximum exposure under these arrangements is unknown; however, the risk of material
loss is currently considered to be remote.
NOTE
2 – VALUATION
Fair
Value The fund’s financial instruments are valued at the close of the NYSE and are reported at fair value, which GAAP defines
as the price that would be received to sell an asset or paid to transfer a liability in an orderly transaction between market participants
at the measurement date. The T. Rowe Price Valuation Committee (the Valuation Committee) is an internal committee that has been delegated
certain responsibilities by the fund’s Board of Directors (the Board) to ensure that financial instruments are appropriately priced
at fair value in accordance with GAAP and the 1940 Act. Subject to oversight by the Board, the Valuation Committee develops and oversees
pricing-related policies and procedures and approves all fair value determinations. Specifically, the Valuation Committee establishes
policies and procedures used in valuing financial instruments, including those which cannot be valued in accordance with normal procedures
or using pricing vendors; determines pricing techniques, sources, and persons eligible to effect fair value pricing actions; evaluates
the services and performance of the pricing vendors; oversees the pricing process to ensure policies and procedures are being followed;
and provides guidance on internal controls and valuation-related matters. The Valuation Committee provides periodic reporting to the
Board on valuation matters.
Various
valuation techniques and inputs are used to determine the fair value of financial instruments. GAAP establishes the following fair value
hierarchy that categorizes the inputs used to measure fair value:
Level
1 – quoted prices (unadjusted) in active markets for identical financial instruments that the fund can access at the reporting
date
Level
2 – inputs other than Level 1 quoted prices that are observable, either directly or indirectly (including, but not limited to,
quoted prices for similar financial instruments in active markets, quoted prices for identical or similar financial instruments in inactive
markets, interest rates and yield curves, implied volatilities, and credit spreads)
Level
3 – unobservable inputs (including the fund’s own assumptions in determining fair value)
Observable
inputs are developed using market data, such as publicly available information about actual events or transactions, and reflect the assumptions
that market participants would use to price the financial instrument. Unobservable inputs are those for which market data are not available
and are developed using the best information available about the assumptions that market participants would use to price the financial
instrument. GAAP requires valuation techniques to maximize the use of relevant observable inputs and minimize the use of unobservable
inputs. When multiple inputs are used to derive fair value, the financial instrument is assigned to the level within the fair value hierarchy
based on the lowest-level input that is significant to the fair value of the financial instrument. Input levels are not necessarily an
indication of the risk or liquidity associated with financial instruments at that level but rather the degree of judgment used in determining
those values.
Valuation
Techniques Equity securities, including exchange-traded funds, listed or regularly traded on a securities exchange or in the over-the-counter
(OTC) market are valued at the last quoted sale price or, for certain markets, the official closing price at the time the valuations
are made. OTC Bulletin Board securities are valued at the mean of the closing bid and asked prices. A security that is listed or traded
on more than one exchange is valued at the quotation on the exchange determined to be the primary market for such security. Listed securities
not traded on a particular day are valued at the mean of the closing bid and asked prices for domestic securities and the last quoted
sale or closing price for international securities.
The
last quoted prices of non-U.S. equity securities may be adjusted to reflect the fair value of such securities at the close of the NYSE,
if the fund determines that developments between the close of a foreign market and the close of the NYSE will affect the value of some
or all of its portfolio securities. Each business day, the fund uses information from outside pricing services to evaluate and, if appropriate,
decide whether it is necessary to adjust quoted prices to reflect fair value by reviewing a variety of factors, including developments
in foreign markets, the performance of U.S. securities markets, and the performance of instruments trading in U.S. markets that represent
foreign securities and baskets of foreign securities. The fund uses outside pricing services to provide it with quoted prices and information
to evaluate or adjust those prices. The fund cannot predict how often it will use quoted prices and how often it will determine it necessary
to adjust those prices to reflect fair value.
Investments
in mutual funds are valued at the mutual fund’s closing NAV per share on the day of valuation. Assets and liabilities other than
financial instruments, including short-term receivables and payables, are carried at cost, or estimated realizable value, if less, which
approximates fair value.
Investments
for which market quotations or market-based valuations are not readily available or deemed unreliable are valued at fair value as determined
in good faith by the Valuation Committee, in accordance with fair valuation policies and procedures. The objective of any fair value
pricing determination is to arrive at a price that could reasonably be expected from a current sale. Financial instruments fair valued
by the Valuation Committee are primarily private placements, restricted securities, warrants, rights, and other securities that are not
publicly traded. Factors used in determining fair value vary by type of investment and may include market or investment specific considerations.
The Valuation Committee typically will afford greatest weight to actual prices in arm’s length transactions, to the extent they
represent orderly transactions between market participants, transaction information can be reliably obtained, and prices are deemed representative
of fair value. However, the Valuation Committee may also consider other valuation methods such as market-based valuation multiples; a
discount or premium from market value of a similar, freely traded security of the same issuer; discounted cash flows; yield to maturity;
or some combination. Fair value determinations are reviewed on a regular basis and updated as information becomes available, including
actual purchase and sale transactions of the investment. Because any fair value determination involves a significant amount of judgment,
there is a degree of subjectivity inherent in such pricing decisions, and fair value prices determined by the Valuation Committee could
differ from those of other market participants.
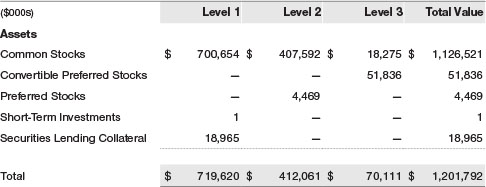
Valuation
Inputs The following table summarizes the fund’s financial instruments, based on the inputs used to determine their fair values
on April 30, 2022 (for further detail by category, please refer to the accompanying Portfolio of Investments):
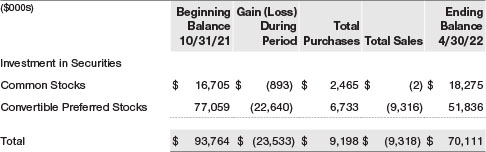
Following
is a reconciliation of the fund’s Level 3 holdings for the six months ended April 30, 2022. Gain (loss) reflects both realized
and change in unrealized gain/loss on Level 3 holdings during the period, if any, and is included on the accompanying Statement of Operations.
The change in unrealized gain/loss on Level 3 instruments held at April 30, 2022, totaled $407,000 for the six months ended April 30, 2022.
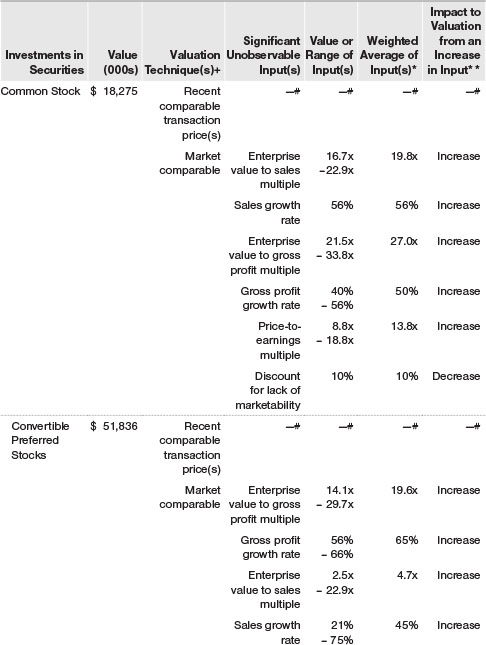
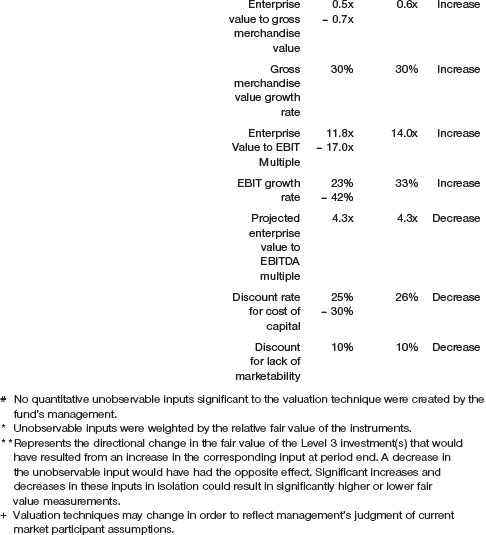
In
accordance with GAAP, the following table provides quantitative information about significant unobservable inputs used to determine the
fair valuations of the fund’s Level 3 assets, by class of financial instrument. Because the Valuation Committee considers a wide
variety of factors and inputs, both observable and unobservable, in determining fair values, the unobservable inputs presented do not
reflect all inputs significant to the fair value determination.
NOTE
3 – OTHER INVESTMENT TRANSACTIONS
Consistent
with its investment objective, the fund engages in the following practices to manage exposure to certain risks and/or to enhance performance.
The investment objective, policies, program, and risk factors of the fund are described more fully in the fund’s prospectus and
Statement of Additional Information.
Emerging
and Frontier Markets The fund invests, either directly or through investments in other T. Rowe Price funds, in securities of companies
located in, issued by governments of, or denominated in or linked to the currencies of emerging and frontier market countries. Emerging
markets, and to a greater extent frontier markets, generally have economic structures that are less diverse and mature, and political
systems that are less stable, than developed countries. These markets may be subject to greater political, economic, and social uncertainty
and differing regulatory environments that may potentially impact the fund’s ability to buy or sell certain securities or repatriate
proceeds to U.S. dollars. Such securities are often subject to greater price volatility, less liquidity, and higher rates of inflation
than U.S. securities. Investing in frontier markets is significantly riskier than investing in other countries, including emerging markets.
Restricted
Securities The fund invests in securities that are subject to legal or contractual restrictions on resale. Prompt sale of such securities
at an acceptable price may be difficult and may involve substantial delays and additional costs.
Private
Investments Issued by Special Purpose Acquisition Companies Special purpose acquisition companies (SPACs) are shell
companies that have no operations but are formed to raise capital with the intention of merging with or acquiring a company
with the proceeds of the SPAC’s initial public offering (IPO). The fund may enter into a contingent commitment with a
SPAC to purchase private investments in public equity (PIPE) if and when the SPAC completes its merger or acquisition. The
fund maintains liquid assets sufficient to settle its commitment to purchase the PIPE. However, if the commitment expires,
then no shares are purchased. Purchased PIPE shares will be restricted from trading until the registration statement for the
shares is declared effective. Upon registration, the shares can be freely sold; however, in certain circumstances, the issuer
may have the right to temporarily suspend trading of the shares in the first year after the merger or acquisition. The
securities issued by a SPAC may be considered illiquid, more difficult to value, and/or be subject to restrictions on
resale.
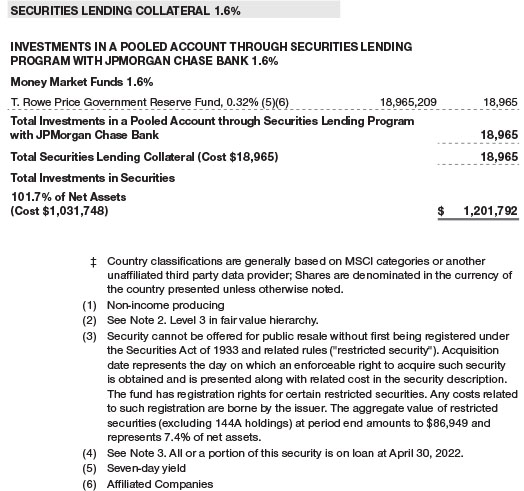
Securities
Lending The fund may lend its securities to approved borrowers to earn additional income. Its securities lending activities are
administered by a lending agent in accordance with a securities lending agreement. Security loans generally do not have stated maturity
dates, and the fund may recall a security at any time. The fund receives collateral in the form of cash or U.S. government securities.
Collateral is maintained over the life of the loan in an amount not less than the value of loaned securities; any additional collateral
required due to changes in security values is delivered to the fund the next business day. Cash collateral is invested in accordance
with investment guidelines approved by fund management. Additionally, the lending agent indemnifies the fund against losses resulting
from borrower default. Although risk is mitigated by the collateral and indemnification, the fund could experience a delay in recovering
its securities and a possible loss of income or value if the borrower fails to return the securities, collateral investments decline
in value, and the lending agent fails to perform. Securities lending revenue consists of earnings on invested collateral and borrowing
fees, net of any rebates to the borrower, compensation to the lending agent, and other administrative costs. In accordance with GAAP,
investments made with cash collateral are reflected in the accompanying financial statements, but collateral received in the form of
securities is not. At April 30, 2022, the value of loaned securities was $17,161,000; the value of cash collateral and related investments
was $18,965,000.
Other
Purchases and sales of portfolio securities other than short-term securities aggregated $428,087,000 and $495,927,000, respectively,
for the six months ended April 30, 2022.
NOTE
4 – FEDERAL INCOME TAXES
No
provision for federal income taxes is required since the fund intends to continue to qualify as a regulated investment company under
Subchapter M of the Internal Revenue Code and distribute to shareholders all of its taxable income and gains. Distributions determined
in accordance with federal income tax regulations may differ in amount or character from net investment income and realized gains for
financial reporting purposes. Financial reporting records are adjusted for permanent book/tax differences to reflect tax character but
are not adjusted for temporary differences. The amount and character of tax-basis distributions and composition of net assets are finalized
at fiscal year-end; accordingly, tax-basis balances have not been determined as of the date of this report.
At
April 30, 2022, the cost of investments for federal income tax purposes was $1,062,080,000. Net unrealized gain aggregated $138,094,000
at period-end, of which $286,258,000 related to appreciated investments and $148,164,000 related to depreciated investments.
NOTE
5 – FOREIGN TAXES
The
fund is subject to foreign income taxes imposed by certain countries in which it invests. Additionally, capital gains realized upon disposition
of securities issued in or by certain foreign countries are subject to capital gains tax imposed by those countries. All taxes are computed
in accordance with the applicable foreign tax law, and, to the extent permitted, capital losses are used to offset capital gains. Taxes
attributable to income are accrued by the fund as a reduction of income. Current and deferred tax expense attributable to capital gains
is reflected as a component of realized or change in unrealized gain/loss on securities in the accompanying financial statements. To
the extent that the fund has country specific capital loss carryforwards, such carryforwards are applied against net unrealized gains
when determining the deferred tax liability. Any deferred tax liability incurred by the fund is included in either Other liabilities
or Deferred tax liability on the accompanying Statement of Assets and Liabilities.
NOTE
6 – RELATED PARTY TRANSACTIONS
The
fund is managed by T. Rowe Price Associates, Inc. (Price Associates), a wholly owned subsidiary of T. Rowe Price Group, Inc. (Price Group).
Price Associates has entered into a sub-advisory agreement(s) with one or more of its wholly owned subsidiaries, to provide investment
advisory services to the fund. The investment management agreement between the fund and Price Associates provides for an annual investment
management fee, which is computed daily and paid monthly. The fee consists of an individual fund fee, equal to 0.35% of the fund’s
average daily net assets, and a group fee. The group fee rate is calculated based on the combined net assets of certain mutual funds
sponsored by Price Associates (the group) applied to a graduated fee schedule, with rates ranging from 0.48% for the first $1 billion
of assets to 0.260% for assets in excess of $845 billion. The fund’s group fee is determined by applying the group fee rate to
the fund’s average daily net assets. The fee is computed daily and paid monthly. At April 30, 2022, the effective annual group
fee rate was 0.28%. Effective November 1, 2019, Price Associates agreed to permanently waive a portion of the fund’s annual investment
management fee in order to limit the fund’s management fees to 0.65% of the fund’s average daily net assets. This agreement
can only be modified or terminated with approval by the fund’s shareholders. The fund has no obligation to repay fees waived under
this arrangement. No management fees were waived under this arrangement for the six months ended April 30, 2022.
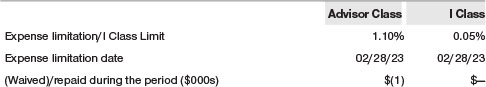
The
Advisor Class is subject to a contractual expense limitation through the expense limitation date indicated in the table below. During
the limitation period, Price Associates is required to waive its management fee or pay any expenses (excluding interest; expenses related
to borrowings, taxes, and brokerage; and other non-recurring expenses permitted by the investment management agreement) that would otherwise
cause the class’s ratio of annualized total expenses to average net assets (net expense ratio) to exceed its expense limitation.
The class is required to repay Price Associates for expenses previously waived/paid to the extent the class’s net assets grow or
expenses decline sufficiently to allow repayment without causing the class’s net expense ratio (after the repayment is taken into
account) to exceed the lesser of: (1) the expense limitation in place at the time such amounts were waived; or (2) the class’s
current expense limitation. However, no repayment will be made more than three years after the date of a payment or waiver.
The
I Class is also subject to an operating expense limitation (I Class Limit) pursuant to which Price Associates is contractually required
to pay all operating expenses of the I Class, excluding management fees; interest; expenses related to borrowings, taxes, and brokerage;
and other non-recurring expenses permitted by the investment management agreement, to the extent such operating expenses, on an annualized
basis, exceed the I Class Limit. This agreement will continue through the expense limitation date indicated in the table below, and may
be renewed, revised, or revoked only with approval of the fund’s Board. The I Class is required to repay Price Associates for expenses
previously paid to the extent the class’s net assets grow or expenses decline sufficiently to allow repayment without causing the
class’s operating expenses (after the repayment is taken into account) to exceed the lesser of: (1) the I Class Limit in place
at the time such amounts were paid; or (2) the current I Class Limit. However, no repayment will be made more than three years after
the date of a payment or waiver.
Pursuant
to these agreements, expenses were waived/paid by and/or repaid to Price Associates during the six months ended April 30, 2022 as indicated
in the table below. Including these amounts, expenses previously waived/paid by Price Associates in the amount of $2,000 remain subject
to repayment by the fund at April 30, 2022. Any repayment of expenses previously waived/paid by Price Associates during the period would
be included in the net investment income and expense ratios presented on the accompanying Financial Highlights.
In
addition, the fund has entered into service agreements with Price Associates and two wholly owned subsidiaries of Price Associates, each
an affiliate of the fund (collectively, Price). Price Associates provides certain accounting and administrative services to the fund.
T. Rowe Price Services, Inc. provides shareholder and administrative services in its capacity as the fund’s transfer and dividend-disbursing
agent. T. Rowe Price Retirement Plan Services, Inc. provides subaccounting and recordkeeping services for certain retirement accounts
invested in the Investor Class and Advisor Class. For the six months ended April 30, 2022, expenses incurred pursuant to these service
agreements were $53,000 for Price Associates; $331,000 for T. Rowe Price Services, Inc.; and $6,000 for T. Rowe Price Retirement Plan
Services, Inc. All amounts due to and due from Price, exclusive of investment management fees payable, are presented net on the accompanying
Statement of Assets and Liabilities.
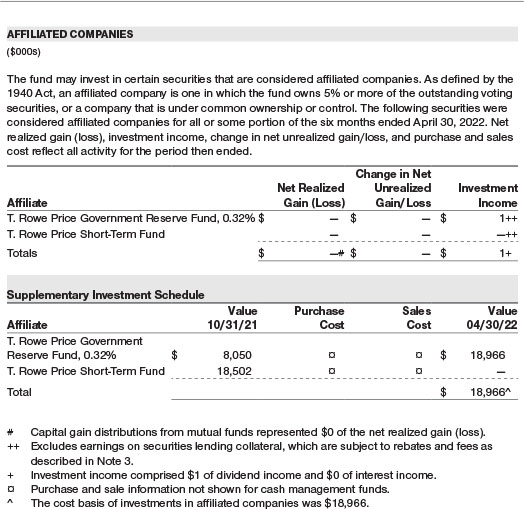
The
fund may invest its cash reserves in certain open-end management investment companies managed by Price Associates and considered affiliates
of the fund: the T. Rowe Price Government Reserve Fund or the T. Rowe Price Treasury Reserve Fund, organized as money market funds, or
the T. Rowe Price Short-Term Fund, a short-term bond fund (collectively, the Price Reserve Funds). The Price Reserve Funds are offered
as short-term investment options to mutual funds, trusts, and other accounts managed by Price Associates or its affiliates and are not
available for direct purchase by members of the public. Cash collateral from securities lending, if any, is invested in the T. Rowe Price
Government Reserve Fund; prior to December 13, 2021, the cash collateral from securities lending was invested in the T. Rowe Price Short-Term
Fund. The Price Reserve Funds pay no investment management fees.
As
of April 30, 2022, T. Rowe Price Group, Inc., or its wholly owned subsidiaries, owned 409,547 shares of the I Class, representing 2%
of the I Class’s net assets.
The
fund may participate in securities purchase and sale transactions with other funds or accounts advised by Price Associates (cross trades),
in accordance with procedures adopted by the fund’s Board and Securities and Exchange Commission rules, which require, among other
things, that such purchase and sale cross trades be effected at the independent current market price of the security. During the six
months ended April 30, 2022, the fund had no purchases or sales cross trades with other funds or accounts advised by Price Associates.
Price
Associates has voluntarily agreed to reimburse the fund from its own resources on a monthly basis for the cost of investment research
embedded in the cost of the fund’s securities trades. This agreement may be rescinded at any time. For the six months ended April
30, 2022, this reimbursement amounted to $24,000, which is included in Net realized gain (loss) on Securities in the Statement of Operations.
NOTE
7 – OTHER MATTERS
Unpredictable
events such as environmental or natural disasters, war, terrorism, pandemics, outbreaks of infectious diseases, and similar public health
threats may significantly affect the economy and the markets and issuers in which a fund invests. Certain events may cause instability
across global markets, including reduced liquidity and disruptions in trading markets, while some events may affect certain geographic
regions, countries, sectors, and industries more significantly than others, and exacerbate other pre-existing political, social, and
economic risks. Since 2020, a novel strain of coronavirus (COVID-19) has resulted in disruptions to global business activity and caused
significant volatility and declines in global financial markets. In February 2022, Russian forces entered Ukraine and commenced an armed
conflict. Economic sanctions have since been imposed on Russia and certain of its citizens, including the exclusion of Russia from the
SWIFT global payments network. As a result, Russian-related stocks and debt have since suffered significant declines in value. The duration
of the coronavirus outbreak and the Russian-Ukraine conflict, and their effects on the financial markets, cannot be determined with certainty.
The fund’s performance could be negatively impacted if the value of a portfolio holding were harmed by these and such other events.
Management is actively monitoring these events.
INFORMATION
ON PROXY VOTING POLICIES, PROCEDURES, AND RECORDS
A
description of the policies and procedures used by T. Rowe Price funds to determine how to vote proxies relating to portfolio securities
is available in each fund’s Statement of Additional Information. You may request this document by calling 1-800-225-5132 or by
accessing the SEC’s website, sec.gov.
The
description of our proxy voting policies and procedures is also available on our corporate website. To access it, please visit the following
Web page:
https://www.troweprice.com/corporate/en/utility/policies.html
Scroll
down to the section near the bottom of the page that says, “Proxy Voting Policies.” Click on the Proxy Voting Policies link
in the shaded box.
Each
fund’s most recent annual proxy voting record is available on our website and through the SEC’s website. To access it through
T. Rowe Price, visit the website location shown above, and scroll down to the section near the bottom of the page that says, “Proxy
Voting Records.” Click on the Proxy Voting Records link in the shaded box.
HOW
TO OBTAIN QUARTERLY PORTFOLIO HOLDINGS
The
fund files a complete schedule of portfolio holdings with the Securities and Exchange Commission (SEC) for the first and third quarters
of each fiscal year as an exhibit to its reports on Form N-PORT. The fund’s reports on Form N-PORT are available electronically
on the SEC’s website (sec.gov). In addition, most T. Rowe Price funds disclose their first and third fiscal quarter-end holdings
on troweprice.com.
APPROVAL
OF INVESTMENT MANAGEMENT AGREEMENT
Each
year, the fund’s Board of Directors (Board) considers the continuation of the investment management agreement (Advisory Contract)
between the fund and its investment adviser, T. Rowe Price Associates, Inc. (Adviser). In that regard, at a meeting held on March 7–8,
2022 (Meeting), the Board, including all of the fund’s independent directors, approved the continuation of the fund’s Advisory
Contract. At the Meeting, the Board considered the factors and reached the conclusions described below relating to the selection of the
Adviser and the approval of the Advisory Contract. The independent directors were assisted in their evaluation of the Advisory Contract
by independent legal counsel from whom they received separate legal advice and with whom they met separately.
In
providing information to the Board, the Adviser was guided by a detailed set of requests for information submitted by independent legal
counsel on behalf of the independent directors. In considering and approving the Advisory Contract, the Board considered the information
it believed was relevant, including, but not limited to, the information discussed below. The Board considered not only the specific
information presented in connection with the Meeting but also the knowledge gained over time through interaction with the Adviser about
various topics. The Board meets regularly and, at each of its meetings, covers an extensive agenda of topics and materials and considers
factors that are relevant to its annual consideration of the renewal of the T. Rowe Price funds’ advisory contracts, including
performance and the services and support provided to the funds and their shareholders.
Services
Provided by the Adviser
The
Board considered the nature, quality, and extent of the services provided to the fund by the Adviser. These services included, but were
not limited to, directing the fund’s investments in accordance with its investment program and the overall management of the fund’s
portfolio, as well as a variety of related activities such as financial, investment operations, and administrative services; compliance;
maintaining the fund’s records and registrations; and shareholder communications. The Board also reviewed the background and experience
of the Adviser’s senior management team and investment personnel involved in the management of the fund, as well as the Adviser’s
compliance record. The Board concluded that it was satisfied with the nature, quality, and extent of the services provided by the Adviser.
Investment
Performance of the Fund
The
Board took into account discussions with the Adviser and reports that it receives throughout the year relating to fund performance. In
connection with the Meeting, the Board reviewed the fund’s total returns for various periods through December 31, 2021, and compared
these returns with the performance of a peer group of funds with similar investment programs and a wide variety of other previously agreed-upon
comparable performance measures and market data, including relative performance information as of September 30, 2021, supplied by Broadridge,
which is an independent provider of mutual fund data.
On
the basis of this evaluation and the Board’s ongoing review of investment results, and factoring in the relative market conditions
during certain of the performance periods, the Board concluded that the fund’s performance was satisfactory.
Costs,
Benefits, Profits, and Economies of Scale
The
Board reviewed detailed information regarding the revenues received by the Adviser under the Advisory Contract and other direct and indirect
benefits that the Adviser (and its affiliates) may have realized from its relationship with the fund. In considering soft-dollar arrangements
pursuant to which research may be received from broker-dealers that execute the fund’s portfolio transactions, the Board noted
that the Adviser bears the cost of research services for all client accounts that it advises, including the T. Rowe Price funds. The
Board received information on the estimated costs incurred and profits realized by the Adviser from managing the T. Rowe Price funds.
The Board also reviewed estimates of the profits realized from managing the fund in particular, and the Board concluded that the Adviser’s
profits were reasonable in light of the services provided to the fund.
The
Board also considered whether the fund benefits under the fee levels set forth in the Advisory Contract or otherwise from any economies
of scale realized by the Adviser. Under the Advisory Contract, the fund pays a fee to the Adviser for investment management services
composed of two components—a group fee rate based on the combined average net assets of most of the T. Rowe Price funds (including
the fund) that declines at certain asset levels and an individual fund fee rate based on the fund’s average daily net assets—and
the fund pays its own expenses of operations. The Board concluded that the advisory fee structure for the fund continued to provide for
a reasonable sharing of benefits from any economies of scale with the fund’s investors.
Fees
and Expenses
The
Board was provided with information regarding industry trends in management fees and expenses. Among other things, the Board reviewed
data for peer groups that were compiled by Broadridge, which compared: (i) contractual management fees, actual management fees, nonmanagement
expenses, and total expenses of the Investor Class of the fund with a group of competitor funds selected by Broadridge (Investor Class
Expense Group); (ii) actual management fees and total expenses of the Advisor Class of the fund with a group of competitor funds selected
by Broadridge (Advisor Class Expense Group); and (iii) actual management fees, nonmanagement expenses, and total expenses of the Investor
Class of the fund with a broader set of funds within the Lipper investment classification (Expense Universe). The Board considered the
fund’s contractual management fee rate, actual management fee rate (which reflects the management fees actually received from the
fund by the Adviser after any applicable waivers, reductions, or reimbursements), operating expenses, and total expenses (which reflect
the net total expense ratio of the fund after any waivers, reductions, or reimbursements) in comparison with the information for the
Broadridge peer groups. Broadridge generally constructed the peer groups by seeking the most comparable funds based on similar investment
classifications and objectives, expense structure, asset size, and operating components and attributes and ranked funds into quintiles,
with the first quintile representing the funds with the lowest relative expenses and the fifth quintile representing the funds with the
highest relative expenses. The information provided to the Board indicated that the fund’s contractual management fee ranked in
the first quintile (Investor Class Expense Group), the fund’s actual management fee rate ranked in the first quintile (Investor
Class Expense Group and Advisor Class Expense Group) and second quintile (Expense Universe), and the fund’s total expenses ranked
in the first quintile (Investor Class Expense Group, Advisor Class Expense Group, and Expense Universe).
The
Board also reviewed the fee schedules for other investment portfolios with similar mandates that are advised or subadvised by the Adviser
and its affiliates, including separately managed accounts for institutional and individual investors; subadvised funds; and other sponsored
investment portfolios, including collective investment trusts and pooled vehicles organized and offered to investors outside the United
States. Management provided the Board with information about the Adviser’s responsibilities and services provided to subadvisory
and other institutional account clients, including information about how the requirements and economics of the institutional business
are fundamentally different from those of the proprietary mutual fund business. The Board considered information showing that the Adviser’s
mutual fund business is generally more complex from a business and compliance perspective than its institutional account business and
considered various relevant factors, such as the broader scope of operations and oversight, more extensive shareholder communication
infrastructure, greater asset flows, heightened business risks, and differences in applicable laws and regulations associated with the
Adviser’s proprietary mutual fund business. In assessing the reasonableness of the fund’s management fee rate, the Board
considered the differences in the nature of the services required for the Adviser to manage its mutual fund business versus managing
a discrete pool of assets as a subadviser to another institution’s mutual fund or for an institutional account and that the Adviser
generally performs significant additional services and assumes greater risk in managing the fund and other T. Rowe Price funds than it
does for institutional account clients, including subadvised funds.
On
the basis of the information provided and the factors considered, the Board concluded that the fees paid by the fund under the Advisory
Contract are reasonable.
Approval
of the Advisory Contract
As
noted, the Board approved the continuation of the Advisory Contract. No single factor was considered in isolation or to be determinative
to the decision. Rather, the Board concluded, in light of a weighting and balancing of all factors considered, that it was in the best
interests of the fund and its shareholders for the Board to approve the continuation of the Advisory Contract (including the fees to
be charged for services thereunder).
Item 1. (b) Notice pursuant to Rule 30e-3.
Not applicable.
Item 2. Code of Ethics.
A code of ethics, as defined in Item 2 of Form N-CSR, applicable to its principal executive officer, principal financial officer, principal accounting officer or controller, or persons performing similar functions is filed as an exhibit to the registrants annual Form N-CSR. No substantive amendments were approved or waivers were granted to this code of ethics during the registrants most recent fiscal half-year.
Item 3. Audit Committee Financial Expert.
Disclosure required in registrants annual Form N-CSR.
Item 4. Principal Accountant Fees and Services.
Disclosure required in registrants annual Form N-CSR.
Item 5. Audit Committee of Listed Registrants.
Not applicable.
Item 6. Investments.
(a) Not applicable. The complete schedule of investments is included in Item 1 of this Form N-CSR.
(b) Not applicable.
Item 7. Disclosure of Proxy Voting Policies and Procedures for Closed-End Management Investment Companies.
Not applicable.
Item 8. Portfolio Managers of Closed-End Management Investment Companies.
Not applicable.
Item 9. Purchases of Equity Securities by Closed-End Management Investment Company and Affiliated Purchasers.
Not applicable.
Item 10. Submission of Matters to a Vote of Security Holders.
There has been no change to the procedures by which shareholders may recommend nominees to the registrant’s board of directors.
Item 11. Controls and Procedures.
(a) The registrants principal executive officer and principal financial officer have evaluated the registrants disclosure controls and procedures within 90 days of this filing and have concluded that the registrants disclosure controls and procedures were effective, as of that date, in ensuring that information required to be disclosed by the registrant in this Form N-CSR was recorded, processed, summarized, and reported timely.
(b) The registrant’s principal executive officer and principal financial officer are aware of no change in the registrant’s internal control over financial reporting that occurred during the period covered by this report that has materially affected, or is reasonably likely to materially affect, the registrant’s internal control over financial reporting.
Item 12. Disclosure of Securities Lending Activities for Closed-End Management Investment Companies.
Not applicable.
Item 13. Exhibits.
(a)(1) The registrant’s code of ethics pursuant to Item 2 of Form N-CSR is filed with the registrant’s annual Form N-CSR.
(2) Separate certifications by the registrant’s principal executive officer and principal financial officer, pursuant to Section 302 of the Sarbanes-Oxley Act of 2002 and required by Rule 30a-2(a) under the Investment Company Act of 1940, are attached.
(3) Written solicitation to repurchase securities issued by closed-end companies: not applicable.
(b) A certification by the registrant’s principal executive officer and principal financial officer, pursuant to Section 906 of the Sarbanes-Oxley Act of 2002 and required by Rule 30a-2(b) under the Investment Company Act of 1940, is attached.
SIGNATURES
Pursuant to the requirements of the
Securities Exchange Act of 1934 and the Investment Company Act of 1940, the
registrant has duly caused this report to be signed on its behalf by the
undersigned, thereunto duly authorized.
T. Rowe Price International Funds, Inc.
| By | /s/ David Oestreicher | |||||
| David Oestreicher | ||||||
| Principal Executive Officer | ||||||
| Date | June 16, 2022 | |||||
Pursuant to the requirements of the
Securities Exchange Act of 1934 and the Investment Company Act of 1940, this
report has been signed below by the following persons on behalf of the
registrant and in the capacities and on the dates indicated.
| By | /s/ David Oestreicher | |||||
| David Oestreicher | ||||||
| Principal Executive Officer | ||||||
| Date | June 16, 2022 | |||||
| By | /s/ Alan S. Dupski | |||||
| Alan S. Dupski | ||||||
| Principal Financial Officer | ||||||
| Date | June 16, 2022 | |||||
Item 13. (a)(2)
CERTIFICATIONS
I, David Oestreicher, certify that:
| 1. | I have reviewed this report on Form N-CSR of T. Rowe Price Global Growth Stock Fund; | |||
| 2. | Based on my knowledge, this report does not contain any untrue statement of a material fact or omit to state a material fact necessary to make the statements made, in light of the circumstances under which such statements were made, not misleading with respect to the period covered by this report; | |||
| 3. | Based on my knowledge, the financial statements, and other financial information included in this report, fairly present in all material respects the financial condition, results of operations, changes in net assets, and cash flows (if the financial statements are required to include a statement of cash flows) of the registrant as of, and for, the periods presented in this report; | |||
| 4. | The registrant’s other certifying officer(s) and I are responsible for establishing and maintaining disclosure controls and procedures (as defined in rule 30a-3(c) under the Investment Company Act of 1940) and internal control over financial reporting (as defined in Rule 30a-3(d) under the Investment Company Act of 1940) for the registrant and have: | |||
| (a) | Designed such disclosure controls and procedures, or caused such disclosure controls and procedures to be designed under our supervision, to ensure that material information relating to the registrant, including its consolidated subsidiaries, is made known to us by others within those entities, particularly during the period in which this report is being prepared; | |||
| (b) | Designed such internal control over financial reporting, or caused such internal control over financial reporting to be designed under our supervision, to provide reasonable assurance regarding the reliability of financial reporting and the preparation of financial statements for external purposes in accordance with generally accepted accounting principles; | |||
| (c) | Evaluated the effectiveness of the registrant’s disclosure controls and procedures and presented in this report our conclusions about the effectiveness of the disclosure controls and procedures, as of a date within 90 days prior to the filing date of this report based on such evaluation; and | |||
| (d) | Disclosed in this report any change in the registrants internal control over financial reporting that occurred during the period covered by this report that has materially affected, or is reasonably likely to materially affect, the registrants internal control over financial reporting; and | |||
| 5. | The registrant’s other certifying officer(s) and I have disclosed to the registrant’s auditors and the audit committee of the registrant’s board of directors (or persons performing the equivalent functions): | |||
| (a) | All significant deficiencies and material weaknesses in the design or operation of internal control over financial reporting which are reasonably likely to adversely affect the registrant’s ability to record, process, summarize, and report financial information; and | |||
| (b) | Any fraud, whether or not material, that involves management or other employees who have a significant role in the registrant’s internal control over financial reporting. | |||
| Date: June 16, 2022 | /s/ David Oestreicher |
| David Oestreicher | |
| Principal Executive Officer |
CERTIFICATIONS
I, Alan S. Dupski, certify that:
| 1. | I have reviewed this report on Form N-CSR of T. Rowe Price Global Growth Stock Fund; | |||
| 2. | Based on my knowledge, this report does not contain any untrue statement of a material fact or omit to state a material fact necessary to make the statements made, in light of the circumstances under which such statements were made, not misleading with respect to the period covered by this report; | |||
| 3. | Based on my knowledge, the financial statements, and other financial information included in this report, fairly present in all material respects the financial condition, results of operations, changes in net assets, and cash flows (if the financial statements are required to include a statement of cash flows) of the registrant as of, and for, the periods presented in this report; | |||
| 4. | The registrant’s other certifying officer(s) and I are responsible for establishing and maintaining disclosure controls and procedures (as defined in rule 30a-3(c) under the Investment Company Act of 1940) and internal control over financial reporting (as defined in Rule 30a-3(d) under the Investment Company Act of 1940) for the registrant and have: | |||
| (a) | Designed such disclosure controls and procedures, or caused such disclosure controls and procedures to be designed under our supervision, to ensure that material information relating to the registrant, including its consolidated subsidiaries, is made known to us by others within those entities, particularly during the period in which this report is being prepared; | |||
| (b) | Designed such internal control over financial reporting, or caused such internal control over financial reporting to be designed under our supervision, to provide reasonable assurance regarding the reliability of financial reporting and the preparation of financial statements for external purposes in accordance with generally accepted accounting principles; | |||
| (c) | Evaluated the effectiveness of the registrant’s disclosure controls and procedures and presented in this report our conclusions about the effectiveness of the disclosure controls and procedures, as of a date within 90 days prior to the filing date of this report based on such evaluation; and | |||
| (d) | Disclosed in this report any change in the registrants internal control over financial reporting that occurred during the period covered by this report that has materially affected, or is reasonably likely to materially affect, the registrants internal control over financial reporting; and | |||
| 5. | The registrant’s other certifying officer(s) and I have disclosed to the registrant’s auditors and the audit committee of the registrant’s board of directors (or persons performing the equivalent functions): | |||
| (a) | All significant deficiencies and material weaknesses in the design or operation of internal control over financial reporting which are reasonably likely to adversely affect the registrant’s ability to record, process, summarize, and report financial information; and | |||
| (b) | Any fraud, whether or not material, that involves management or other employees who have a significant role in the registrant’s internal control over financial reporting. | |||
| Date: June 16, 2022 | /s/ Alan S. Dupski |
| Alan S. Dupski | |
| Principal Financial Officer |
Item 13. (b)
| CERTIFICATION UNDER SECTION 906 OF SARBANES-OXLEY ACT OF 2002 | ||
| Name of Issuer: T. Rowe Price Global Growth Stock Fund | ||
| In connection with the Report on Form N-CSR for the above named Issuer, the undersigned hereby certifies, to the best of his knowledge, that: | ||
| 1. | The Report fully complies with the requirements of Section 13(a) or 15(d) of the Securities Exchange Act of 1934; | |
| 2. | The information contained in the Report fairly presents, in all material respects, the financial condition and results of operations of the Issuer. | |
| Date: June 16, 2022 | /s/ David Oestreicher |
| David Oestreicher | |
| Principal Executive Officer | |
| Date: June 16, 2022 | /s/ Alan S. Dupski |
| Alan S. Dupski | |
| Principal Financial Officer | |